

In Writing 365 Track - Behind the scenes, Part 1 I shared how I use Microsoft Excel to track my writing progress. In Part 1, we looked at the Log and DailyCount worksheets. In Part 2, I will walk you through my Summary worksheet, which contains several tables and charts.
Word count by category
My writing this year fits into four categories: journal, devotional, blog post, and e-book. Theoretically, by the end of the year, each category should have at least 91,250 words. In the top left corner of the worksheet is a summary of the word counts for each category. The SUMIF formula is to calculate this (see Part 1)
Weekly word count
For each week (staring on Friday and ending on Thursday) the word count is automatically calculated using the SUMIF formula. SUMIF is an extremely convenient formula, which I use frequently. The columns in this table are week, actual (words), start date, and end date.
Writing 365 weekly summary
I post a weekly summary on this blog each week. Although I write the post on Friday, I delay publication until Sunday. For the Writing 365 portion of the summary, I put together the following chart.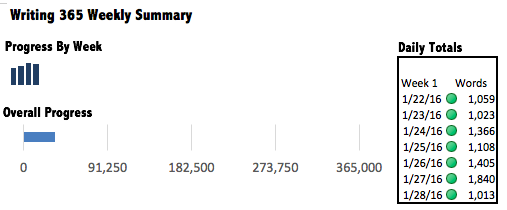
It is a combination of three elements:
- a bar chart depicting overall progress towards 365,000 words
- a sparkline using columns which depicts the total for each week
- summary of the week by day
BAR CHART
The overall progress bar chart is about as simple as charts come in Excel. I used the chart wizard to create a chart and eliminated everything but the essential elements. Everything in an Excel chart can be edited or deleted. Of the spreadsheet programs available (Microsoft Excel, Apple Numbers, Google Sheets, etc.) Excel is by far the most powerful from the perspectives of analysis and charting.
SPARKLINE
The sparkline data is pulled from the weekly word count table. A sparkline is different from traditional charts in Excel because a sparkline is designed to provide trending information while contained in only one cell. Sparklines options are line, column, and win/loss. In the image below, the Line and Column sparklines use the data from the Words column, while Win/Loss uses data from the Change column.

DAILY WORD COUNT
The word count table uses SUMIF to pull the daily word count from the DailyCount worksheet discussed in Part 1. I use conditional formatting to generate a red dot for days with no words, a yellow dot if any words have been written, and a green dot if the daily goal of 1,000 is surpassed.
No comments:
Post a Comment