
The National Center for Education Statistics (NCES) houses a variety data and tools on education from across the United States. A subsite of the main webpae is NCES Kids Zone. Embedded within this site is a basic charting wizard. While you won't find the advanced editing and functionality of Excel, it is great for creating charts quickly when you might not have another option available. It works on iPad and integrates with other apps, including KeyNote and Pages.
The website is: http://nces.ed.gov/nceskids/createagraph/default.aspx
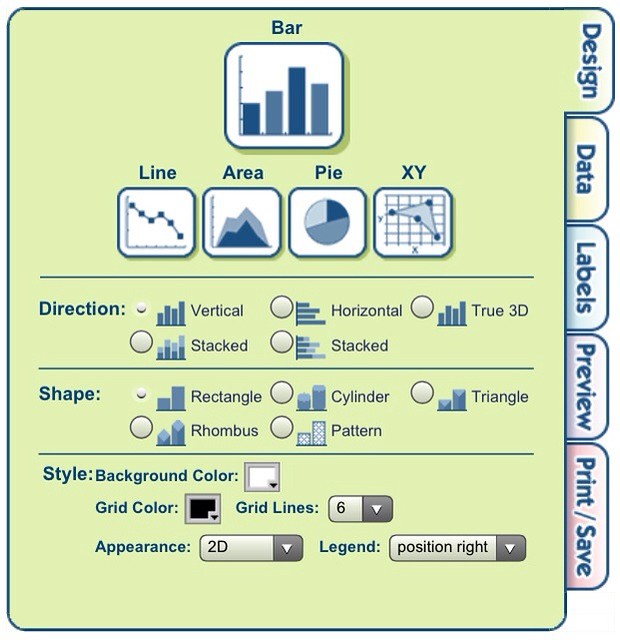
Below is a partial screen capture that displays the user interface. The Five-tab structure is easy to navigate and provides several options to configure the colors and settings of several chart characteristics. You can output your finished chart in a choice of formats including PDF, jpg, png, and many others.
I encourage you to visit NCES Kids Zone and give it a try.