Wednesday, April 30, 2014

TEDx Henderson State U

TED is an organization dedicated to spreading ideas related to technology, education, and design.  People gather at TED conferences held on a regular basis, and the videos of the talks are available on the TED.com website.  The large TED conferences typically include speakers who have done cutting edge research, approached design differently, or are thought to be making a difference in the world.

If you want to attend the TED conference there are two challenges.  First, the admission price is fairly expensive.  Second, the tickets sell out fast.


TEDx

As TED talks have become more popular, the TED organization started licensing independently organized TED events identified with the letters "TEDx."  TEDx events are usually smaller and locally organized events.

I had the opportunity of attending a TEDx event sponsored by Henderson State University in Arkadelphia, Arkansas.  I was quite excited to be able to attend a TED-related event, and the ticket price was inexpensive at $5.00 per person.  Since I purchased tickets for my wife and me online, our name badges were waiting for us at the registration table when we arrived.  We entered the classroom theater, dark and cool, and awaited the start of the program.

Speakers

TEDx Henderson State U featured three speakers.  The first was a student who has been studying and photographing snakes for several years.  Part of the TED experience is large, close-up graphics, and I can tell you there's nothing like large snake pictures to capture attention!

The second speaker was a professor of economics from the university.  His talk centered around coffee and how charity coffee programs, such as Fair Trade Coffee, do not really result in the economic benefit to coffee growers as expected.  His advice?  Drink the coffee you like.

The third speaker was a local entrepreneur who accomplished her goals despite a number of overwhelming hardships.  She encouraged others to pursue their goals.

Between each of these live presentations, a recorded TED talk was inserted.


The concept of TED, to share ideas and new ways of thinking, is an great exchange, and TEDx continues that traditional by bringing communities together to think about new world views and discuss similar and differing opinions.

If you have an opportunity to attend a TEDx event, I encourage you to take advantage of the opportunity.

If you found this post helpful, please comment below and share on Facebook.

Tuesday, April 29, 2014

These Easter eggs (tricks) save me lots of time

Most online search engines have the capability for advanced searches where you can specify information in several fields including sites, files types, combinations of words, etc.

You can accomplish many of the advanced features simply by using the parameters below in your regular searches.

An "Easter Egg" is a term from the gaming world which refers to a hidden or previously unknown feature.

While these may not work on all sites, these Easter eggs work on the Big 3:  Google, Yahoo!, and Bing.


If you found this post helpful, please leave a comment below and share on Facebook.

Tuesday, April 22, 2014

Moving from Flickr to DropBox for Photo Storage

Uploading is easy, Downloading is hard

It is easy to upload photos in batches to Flickr.  The upload wizard used by the site makes it convenient to drag files over to Flickr or select multiple photos from your computer.  However, photos can only be downloaded individually.  Even with that, you have to first select the photo, view all sizes, and then download the desired size - in my case, the original.

Options for downloading multiple images from flickr

FlickAndShare allows you to select a set of photos (now called an "album" on flickr) to either download or share with others.  It is Java-based and can be unstable from time to time.  In my case, when trying download my entire flickr library, the applet for FlickAndShare never loaded properly.  One nice feature of FlickAndShare is that it is free.  It is also an online service.  No download or installation is necessary.

 
Bulkr is a free program to download and use with limited functionality.  In order to download original size images you must pay, either per year for $30 or a lifetime price of $40.  Bulkr downloads images from selected set or your entire photostream to your computer.  From there, it was an easy transfer to DropBox.  FlickAndShare only permits you to download photos from your own photostream.  Bulkr allows you to download any photos that are public on flickr (as well as your own photostream).

Process for transferring photos


Step 1:  Download selected images from flickr using Bulkr.  I have over 3,300 images on flickr, but only downloaded about 2,000 that were part of sets/albums.

Step 2:  Move the images from my computer to DropBox.  Although files with small sizes are synced fairly fast between a computer and DropBox, several gigabytes worth of images took several hours to sync. 

Step 3:  Identify images that should be public and move them into DropBox's public folder.  Photos that I share with others, including images for this blog and my food blog will be stored in the public folder while everything that I want to keep private (family pics, etc.) will be stored in a regular folder on DropBox.


Monday, April 21, 2014

Thinking about options for photo storage

Since 2007 I have stored my public and private photos on Yahoo's photo sharing site Flickr.  Until last year Flickr had a nice interface for uploading, editing, and organizing photos.  However, during the past year Flickr has made several changes to the navigation of the web version (accessed from computers) and the apps.

Time for a change from flickr

Each time that changes occurred, the feedback generally was negative.  I, like others, found that the changes did not work for me in terms of viewing images and sharing images.  Last year, when I paid the subscription price for the pro version (i.e., no ads) I thought "I need to find a better solution."  This year, after again paying for the subscription and recent changes made to the iPhone/iPad apps, I realized that the time for change had come.

Process to review other options

I knew that there were other photo sharing/storage site and wanted to explore the possibilities.  I did a simple web search for "best sites for online photo storage."  Several different lists were provided.  After reviewing the lists, I decided to try two online sites.

However, before starting the evaluation process, I made a list of requirements for what I wanted:
  • Online - I must be able to access the photos from anywhere anytime without having to be connected to my home network.
  • Sharing - I want to be able to share images with others and online (blog posts and web sites).
  • Access from iOS - I need to be able to view and manage photos from my smart phone and tablet.
  • Tagging - It would be nice to add keywords to the picture metadata (fields that describe the photo) for quick searches.
  • Keep original sizes - I want to ensure that any solution would permit me to store the full size images.
  • Upload from any device - Because I take pictures with my phone sometimes edit them on my tablet, I need to be able to add pictures from my phone, tablet, or computer.
  • Cost as a factor - I would like to save some money where possible.
  • Interface satisfaction - I want an interface that I find easy and intuitive.  

Comparison of results

After creating this list, I compared Flickr, SmugMug, Zenfolio, DropBox, and simply using my computer's hard drive to store photos.  The chart below displays the results of my evaluation.  A "check" means that the requirement was satisfied and an "x" means that it was not.


You'll notice that the cost per year for DropBox has a "*" beside "Free."  Because I subscribe to DropBox anyway, there is no additional cost for adding my photos.  So far, after 7 years of photos, my photo library accounts for about 3% of my total available storage on DropBox.

Decision - DropBox

At least for now, I will use DropBox to store my photos.  In addition to easy access for all devices for viewing and uploading, DropBox's public folder makes it easy to share multiple images, and I can share as needed in addition.

This is a fairly risk-free decision because all my photos that are currently on Flickr will remain there.  If I see that DropBox does not work out, I'll definitely post the results here and explore more online solutions at that time.

If you found this post helpful, please comment below and share on Facebook.

Thursday, April 17, 2014

Create a run chart

Run charts are a type of line graph that depict measurements tracked over time. The two lines plotted on the chart are the actual measurements and the average or mean of the measurements. The average line is helpful to identify which measurements are above or below average. The average is also a quick way to compare the first set of collected information and what will be collected later (see Overview of Personal Quality Improvement).
 
In the last PQI post on collecting your first measurements, I wrote about recording some measurements over a period of 20-30 days. Once you have completed collected data, it is time to transfer information to a spreadsheet in order to calculate the average and then create a run chart.
 
SPREADSHEET SOFTWARE
Microsoft Excel was introduced in 1985 as a spreadsheet alternative to Lotus 1-2-3. Apple Numbers was introduced in 2007. Although Numbers doesn't have the powerful engine that Excel has in terms of formulas and complex data management, it does have the advantage of working across platforms. Numbers works seamlessly on iPhones, iPads, as well as Mac computers. A third, free alternative, is an online preadsheet program developed by Google. Google Spreadsheets has fairly extensive functionality and is accessed via the Internet. All of files are stored in Google Drive.
 
MY ITUNES PURCHASES
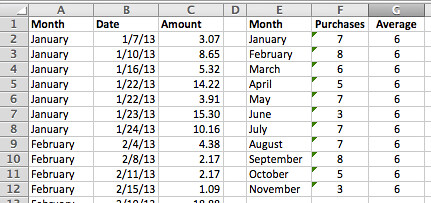
For the two charts below, I decided to use my iTunes purchased in 2013. I first downloaded a list of all of my iTunes purchases from January through November. After entering the data in columns A, B, and C, I used a couple of formulas to summarize the data by month (columns E, F, and G).
 
iTunes Raw Data
 
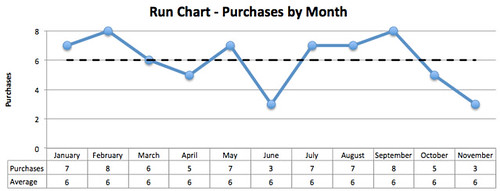
The "Purchases" (column F) shows counts of column A. In column G, "Averages," the number is simply the total number of purchases (from column F) divided by 11 months. Below is the resulting run chart:
 
 
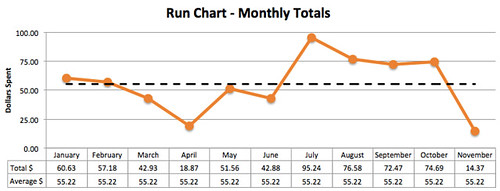
I also created a similar data set and run chart for the total amount spent per month.
 
iTunes Dollars Jan-Nov
 
In looking at these two charts, I can see that I spend more money than I would prefer on apps, music, and books from iTunes, and probably visit the store too often. In a later post, I will use this information to more closely analyze my iTunes purchases. For now, however, I accomplished my goal of objectively and simply transferring the data into a chart for a graphical view of the measurements.
 
If you collected data as discussed last month, it is now time to create your own run charts.
 
The link below will open a Google Spreadsheets file that you can save to you own Google Drive (free to setup and use). The first tab labeled "RunChartData" is the one you should select. The spreadsheet is currently populated with 30 sample data points. The average column is automatically calculated. The updated chart is displayed on the "RunChartGraph" tab.


Tuesday, April 15, 2014

Eliminate these to instantly improve your public speaking

I had a principal in high school who couldn't put two words together without inserting "um" in between them.  I also, more recently, worked with someone who was almost as bad.  Imagine my horror when my wife told me the other day, "You said 'um' a lot on that call."  Wow!  That is bad!

Presidents do it, reporters do it, everybody does it

When you focus on a particular area, your observational sensitivity will improve.  For several years I drove a red Saturn Vue, a midsize sport utility vehicle (SUV).  Once I started driving the Vue, I noticed other Saturn Vues.  Now that I drive a Honda Accord, I seem to notice more Accords on the road.  The same phenomenon is true when observing people. 

Um and Uh

Once I started paying attention to "ums" it seems like I found them everywhere.  While driving today, I heard politicians, reporters, and others use "um." Using "um" seems to be the, um, audible sound designated to represent thinking. 

So

Another word that is overused is "so."  So, I started listening for that too.  Not only is "so" frequently heard in conversations, it is also proliferating into print.  Perhaps starting a periodic sentence with "so" is alright, a series of sentences is not.

You know

"You know" can also be heard in conversations.  Perhaps people use this, you know, as a slight delay to allow thinking to catch up.  Most of the time, I don't know!

Thing

Another word that I tend to overuse is "thing."  When I can't think of the actual word, I'll substitute "thing."  While "thing" can be used as a substitute for things, as indicated from the Dictionary.com definition below, I personally think it is used to much.


Samuel Clemens and the damn very

The famed author Samuel Clemens (also known as Mark Twain) wrote, "Substitute 'damn' every time you’re inclined to write 'very'; your editor will delete it and the writing will be just as it should be."

Clemens point: "very" was (and still is) overused.  Perhaps the same strategy would work to eliminate other overused words.

My list of words to eliminate

I decided to make a concerted effort to improve my speaking by eliminating these words:
  • um
  • so
  • you know
  • thing

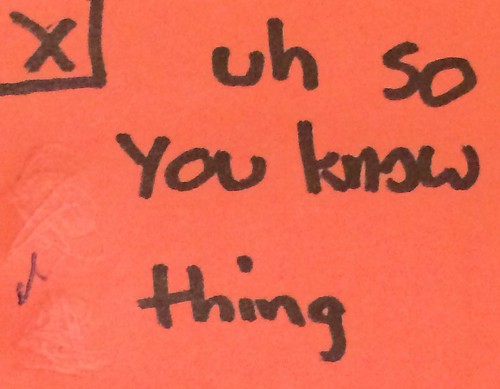
To provide a visual cue, I wrote these words on a self-adhesive note and keep it in my planner.  My wife saw this note and asked, "What is 'uh so you know thing?'"  A tragic sentence would be one where all of these are strung together.  "Um ... so ... you know ... that thing I was talking about."


"Metathinking" is a term used to describe thinking about thinking.  As I speak, I am trying to anticipate what I'm about to say in order to filter out um, so, you know, and thing. 

Change takes time

Simply deciding to make a change and writing that change on a piece of paper doesn't mean instant success.  However, I believe that overtime I will come closer to achieving my goal of eliminating these words from my vocabulary.  I encourage you to seek feedback from trusted others or record yourself to see if you use any of these words.

If you found this post helpful, please comment below and share on Facebook.

Thursday, April 10, 2014

Lofi Gamification

Gamification - Applying game rewards to other areas

Especially in the business community, the term "gamification" has become popular.  Gamification refers taking elements from game play, such as rewards and levels, and applying them to business processes, such as sales, learning, and using websites.  Examples of gamification elements include a points system, levels, leader boards, badges, and progress bars.

Old concepts in new packaging

Although gamification is a fairly new term, the concepts of rewarding and recognizing behavior have been around for thousands of years.  BF Skinner quantified and documented the basic principles of reinforcement in his book The Science of Human Behavior.  The behavior reward sheets that are used to reinforce the behavior of children also fit into the category of gamification. 

Badges are everywhere

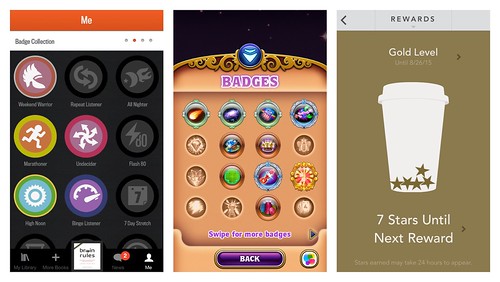
It seems like badges can be found everywhere.  Much like scout badges, when you complete certain tasks, you receive a badge.  Below are badges from Audible's audio book app, badges from the game Bejeweled, and stars earned towards a free item at Starbucks.


Why gamification works - motivation

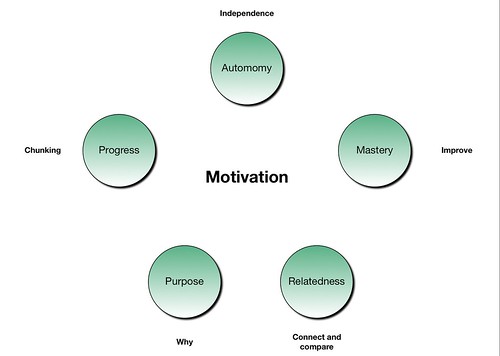
The science behind gamification is a combination of internal and external motivation.  Five components of motivation that apply to gamification are
  1. autonomy - a desire for independence
  2. mastery - a desire to improve
  3. relatedness - a desire to connect with others and compare your experiences
  4. purpose - a desire to answer "why"
  5. progress - a desire to be oriented and divide tasks into small segments or chunks


Make your own badges

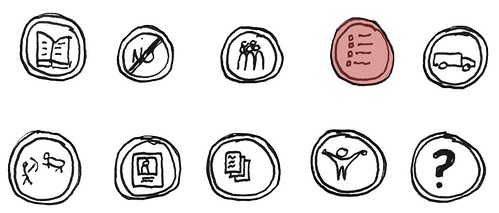
I've been working on a large project where I am writing out tips for presentations in several categories.  After learning about gamification and badges, I decided to create a set of badges that I can highlight as I make progress.  This is a low fidelity method of gamification because it is basically circles drawn on paper. 

The categories of tip are:
  • Continually learn.
  • Remember that "no" is just a word.
  • Understand your audience.
  • Develop an action plan.
  • Check on the logistics.
  • Tell stories.
  • Use visuals.
  • Create handouts.
  • Engage your audience.
  • Ask questions.

My hand-drawn badges are displayed below.  So far, I have earned one badge by completing all of the tips related to that category.


Tuesday, April 8, 2014

FaceTime Imagined in 1879

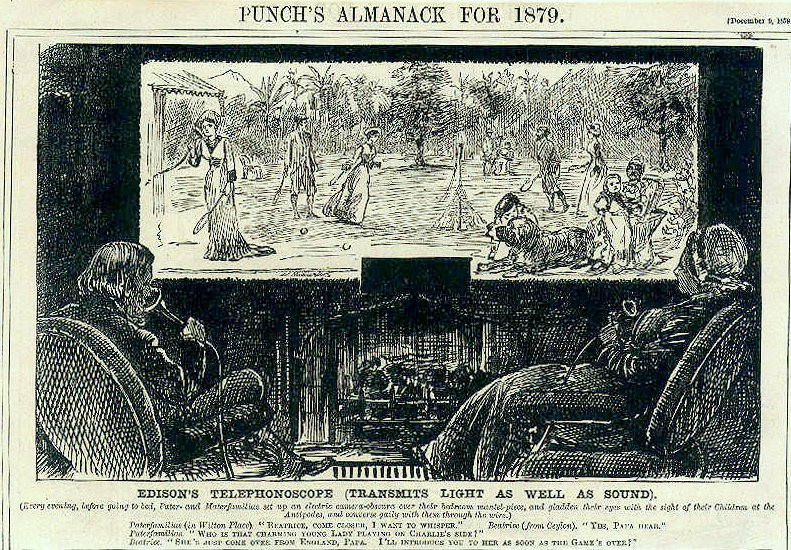
In his book, The Design of Everyday Things, Don Norman includes the picture below.


This drawing, from 1879, shows a picture of a mother and father interacting with their children via video chat.  The fact that this was conceived even before early movie cameras is an amazing testament to the vision and imagination of the artist.

"On Screen"

The drawing reminded me of the viewing screen on the Star Ship Enterprise from the Star Trek television series and movies.  All of the captains of various Space Federation star ships have said, "On screen," in order to have tactical, communications, or other information displayed on the main monitor on the ship's bridge.


Current video technology has not yet achieved the smoothness and real-time speed without data interruptions portrayed in both of these imaginative and fictional portrayals.  Perhaps we'll get there someday.

Stretch Goal

Clearly, in 1879, the technology did not exist as imagined in the scene.  That did not stop the artist from drawing what he thought the future might look like.

What can you imagine or design today that might eventually be a reality in 150 (or more) years?


Monday, April 7, 2014

PQI - Collect your first measurements

Last month I shared a post which described an overview the personal quality improvement plan, also known as PQI.  In today's post, I will walk you through the steps to create or select a tracking log, decide on actions to track, and some tips to make collecting your measurements as easy as possible.

QUANTIFIED SELF
Quantified Self is a website and movement dedicated to "self knowledge through numbers."  Followers of the this methodology rigorously collect all kinds of detail about themselves from how many hours they sleep, number of minutes exercising, routes walked from Point A to Point B, etc.  Quantified Self chapters exist in many cities.  When the members connect at gatherings, they share information on how to better collect information about themselves and discuss any insights they may have gained along the way.

FELTRON
Nick Feltron has been collecting his personal data and publishing in very artful ways for several years.  He collects everything from number of photos taken to pages read to calendar entries, etc.

COLLECTED DATA VS. USED DATA
While Quantified Self members and Nick Feltron may enjoy some pleasure in collecting and sharing data, the journey for them seems to be about the process of collecting the data - not using the data collected for some purpose.  The collection of measurements for PQI is different.  The data that you collect will begin a journey of improvement.

HISTORY OF TRACKING DATA
For many years, therapists have routinely asked clients to track specific data about themselves (for example, the number of times relaxation exercises are done, the number of times you think about a specific object or person, or frequency of negative thoughts).  Additionally, a routine part of assessments for attention deficit disorder in children is for parents and teachers to independently observe the child's behavior to determine the extent that the child is distracted in the classroom and at home.

CREATE A TRACKING LOG
The first step to collecting measurements is to create or select a tracking log.  Once the tracking log is created, you will use it to keep a record of selected measurements for 25-30 consecutive days.

A small note book is ideal for record keeping.  Additionally, you can use an app on your smartphone to record measurements.  Another convenient way to track data is to create your own small booklet specifically designed for capturing measurements.

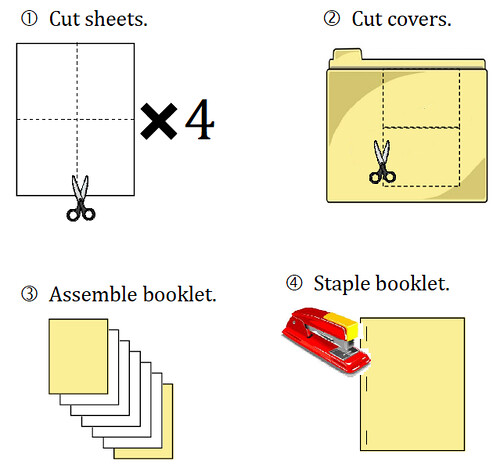
DIY Tracking Log
  • Take 4 sheets of 8.5-inch by 11-inch copy paper (blank), cut in half and in half again.  The final size will be 4.25 x 5.5 inches.
  • Using a file folder or card stock, cut out two covers with the same dimensions as the final paper size.
  • Assemble the sheets between the file folder covers.
  • Staple along the edge.
  • The result is a book with 32 pages for entries.

PQI Baseline Booklet


IDENTIFY AREAS TO TRACK
The second step is to identify areas to track.  The following guidelines will help you select areas (known as variables) to track and record.
  • Select no more than 3-4 variables.
  • What you are tracking must be under your control (e.g., money spent, minutes of exercise).
  • Because there should be a minimum of 15-20 measurements per variable, select activities that occur every day or frequently.  If you select something that occurs less frequently, you should keep recording until at least 15-20 measurements are collected.
  • The areas you decide to track must be of interest to you.
  • The areas must be measurable (quantifiable).
  • Whatever you select must be easy to record without disruption.  If you don't record actions as they occur, it is very likely that you will forget to record information later.
  • Likewise, it should not take too much time to record measurements.
  • Be honest with yourself and record accurately whatever you select.

Examples of Variables
Variables to Count
-calories
-text messages
-miles driven
-sales visits
Time spent
-reading
-sleeping
-exercising
-video gaming
Money spent on
-snacks
-meals
-entertainment
-clothing
Categories/Yes-No
-types of foods
-meals at home
-days exercising
-days studying

START TODAY
Following the instructions above, start tracking 3-4 variables today.  If you take measurements every day, by the time I discuss how to summarize your data in next month's PQI posting, you will be ready to proceed.

Wednesday, April 2, 2014

Why You Should Create Your Own Stock Photo Library

Use personal or original pictures

Flickr is a photo storage and sharing site that is part of the Yahoo! family of companies.  In 2013 Flickr announced that each account would have an unprecedented amount of storage for free:  1 terrabyte (that's 1,000 gigabtyes).  Most smart phones and tablets have 32 to 128 gigabytes of storage.  A article from 2007 featured the headline, "2-billion photos on flickr."  Towards the end of 2013 (when this book was written), there were over six billion photos stored on Flickr.  According to a different article from 2011, Facebook has an estimated 60 billion photos.  Clearly, today, there are billions of photos online.  The statistics above only include Flickr and Facebook.  Instagram, Picasa, Photobucket, and Tumblr are also popular photo sites.

http://techcrunch.com/2007/11/13/2-billion-photos-on-flickr/
http://mashable.com/2011/02/14/facebook-photo-infographic/

Stock photography

In addition to the photo sharing sites mentioned above, there are also a number of websites dedicated to stock photography and clipart.  Stock photos are those taken by professional photographers and available to a variety of online and print uses.  Some stock photos are free but many others cost from a few pennies to several dollars to download based on the file resolution and intended use.  Microsoft used to have a well-organized and large clip art collection which included photos and line drawings.  However, Microsoft now directs users to the Microsoft-owned search engine, Bing.com.

Challenges of stock photography

A challenge faced by anyone who wants to use any of the billions of available photos or images is that photos are considered to be copyrighted by the photographer unless designated otherwise using a creative commons license or in the public domain.  While many presenters violate copyrights and use images anyway, it is illegal to use photos without permission.

Another challenge is that stock photography is available to anyone who is willing to search and buy the desired images.  This means that the photos or clip art you choose to use may have already been over-used by others.  Characteristic photos that are seen too often include a multicultural group of business professionals gazing happily into the camera or looking intently into a computer screen.  Another "classic" is a group of people jumping.  Photos of people intently talking or shaking hands are also popular.

Create your own clip art library

Rather than sort through the billions of photos with the hope of finding images to use for free and with permission while simultaneously identifying unique images, why not create your own clip art library?  All of the challenges listed above are minimized or eliminated when you create your own content.

Recently I saw an advertisement for the Apple iPhone boasting that more photos are taken with the iPhone's on-phone camera everyday than any other camera.  Every smart phone has a camera.  The resolution of phone cameras continues to increase with some cameras boasting resolution at 16 or 20 megapixels.  Take advantage of the camera power in your pocket or purse.

Step 1.  Plan for the photos you need.

Like all of the other planning essential for a presentation, thinking about what visuals will enhance your message and what specifically needs to be included in the video.  If you are presenting on a computer-related topic, perhaps someone's hands typing on a keyboard will be beneficial.  If you are need photos of objects such as fruit or clothing, take a trip to the local grocery store or mall.  Study photos that you like and use these as guides for creating your own pictures.

Step 2.  Get permission (sometimes).

There are many places that are public, and you can take photos to your heart's content (generally because exceptions exist).  However, if you plan to take photos in a store and the branding will be recognizable, ask permission of the store owner or manager.  Consensus is mixed on when you need subjects of photos to sign release forms.  My recommendation is that if you used posed photography specifically for the purpose of use in presentations, ask the subjects to fill out a release.

Photo release form
http://www.free-legal-document.com/model-release-form.html
http://dpcorner.com/all_about/releases.shtml

References
http://en.wikipedia.org/wiki/Photography_and_the_law#United_States
http://usatoday30.usatoday.com/tech/columnist/kimkomando/2008-04-17-public-photography_N.htm
http://www.danheller.com/model-release.html#summary

Step 3.  Use an online photo storage/sharing site to organize your pictures. 

In addition to the sites discussed above (Flickr, Picasa, and Photobucket), there are a number of sites designed for professional photographers to showcase their portraits.  The sites usually have free or budget plans that will fit your needs.  I currently have over 3,000 photos on Flickr.  Online sites offer many advantages including protection from physical or technical loss, the ability to add keywords to photos, the ability to create sets and groupings, and privacy settings.

Step 4.  Add titles, tags, and descriptions.

By identifying your photos with titles, tags, and descriptions, you will be able to search through your photos quickly to identify what you need.  While this may not seem important at first, over time you may amass several photos, and forget what you may already have available in your own clip art collection.

Step 5.  Edit your photos.

Numerous photo editing option exist for computers, tablets, and smart phones. 

Step 6.  Walk towards the light.

One secret of professional photography is light.  Photographs taken with good lighting look far better than those taken in dark rooms or using incorrect flash settings.  I know for me, my smart phone takes fantastic pictures outside, but not so much inside.

As you practice taking photos for clip art purposes, your expertise and judgment will increase.  Before you know it, you may have the eye to recognize potential clip art photos wherever you look.

If you found this post helpful, please comment below and share on Facebook.

Tuesday, April 1, 2014

Personal Quality Improvement

Recently, I shared a post on the history of quality improvement.  Quality improvement is now a vital part of operations in business and healthcare.  Departments that focus on quality are also present in manufacturing, education, government, and anywhere there is a desire to improve the outcomes of products and services.

Models of quality

Three popular models of quality improvement are PDSA, TAMMCS, and DMAIC.  Many books and training courses of varying length and intensity have been written - and continue to be written - about these models.  This is an extremely brief summary ...

PDSA = Plan, Do, Study, Act (Deming's quality model)
PDCA = Plan, Do, Check, Act (variation of PDSA)
TAMMCS = Team Aim Map Measure Change Sustain (a government model for quality)
DMAIC = Define, Measure, Analyze, Improve, Control (from Six Sigma)

Personal Quality Improvement

Personal Quality Improvement (PQI) is an application of the principles of quality improvement applied to the individual.  Most quality efforts focus on changing organizations and redesigning systems for better performance.  Change will occur when you apply the same principles to your life!

The PQI model is centered around the individual.  In order for change to occur there must be personal effort.  There is no team in PQI.  Any processes, evaluations, and changes result from the amount of personal investment.

PQI consists of a four-step process that includes identifying something that needs to be changed, developing a plan of action, executing the plan, and assessing the outcome.  The keywords of each step form the acronym IDEA - identify, develop, execute, assess.

Phase 1:  Identify an area to change

Before change can be realized, some kind of evaluation must take place that identifies something that needs to be changed.  For PQI, examples of change might be weight loss, spending less money, or devoting more time to children or hobbies.  The steps to identify an area of change include:

  • Take an initial measurement of 3-4 areas that might be suitable to the PQI process.
  • Create visual, graphic summaries of the recorded measurements.
  • Select one problem area to address.
  • Explore the details related to that problem including actions that you take, processes you follow, and possible root causes.

Phase 2:  Develop a plan of action

Once a problem has been selected, it is time to set a goal for change, brainstorm possible solutions or steps for improvement, how to implement solutions, and test - on a small scale - strategies that will result in the desired changes.

During this phase of PQI, long-term and short-term goals are established.  A variety of brainstorming methods are applied to design ways to achieve goals.  A plan of action is created that you will follow for a second measurement period referred to as "action measurement."  The plan of action undergoes a brief trial run in order to evaluate if it will work and to make any changes in the plan.

Phase 3:  Execute the plan

Implementing the plan of action is probably the easiest phase of the PQI process.  You simply follow the plan you developed previously and record measurements.  During this phase, you are not even concerned about whether change is occurring.  At the end of the action measurement period, you create visual, graphic summaries that will be used to compare the initial and action measurement periods.

Phase 4:  Assess the outcome

By comparing graphic summaries from the initial and action measurement phases, the degree of change is assessed.  If change did occur, it is also compared to the goals specified in Phase 2.  A future direction is also determined, which can include whether the plan of action needs to be revised or a new problem identified.  Experience from failures as well as successes can result in better outcomes.

Over the next few months, I will be describing each of the phases and steps in more detail.